Among all the uncertainties about future climate change, one thing we do have confidence in is the pattern of surface warming. This is a very useful thing to know, for instance because we can use pattern scaling to get a reasonable first-order estimate of regional warming: non-dimensionalizing the pattern by the change in global-mean surface temperature, local warming in some scenario (T) = global-mean surface warming (T) x the pattern.
As an example, this is a figure from a review paper by Xie et al. (2015) on improving predictions of regional climate changes, and shows the CMIP5 model-mean changes in surface temperature (top) and precipitation (bottom) under the RCP4.5 scenario between 2081-2100 and 1986-2005:
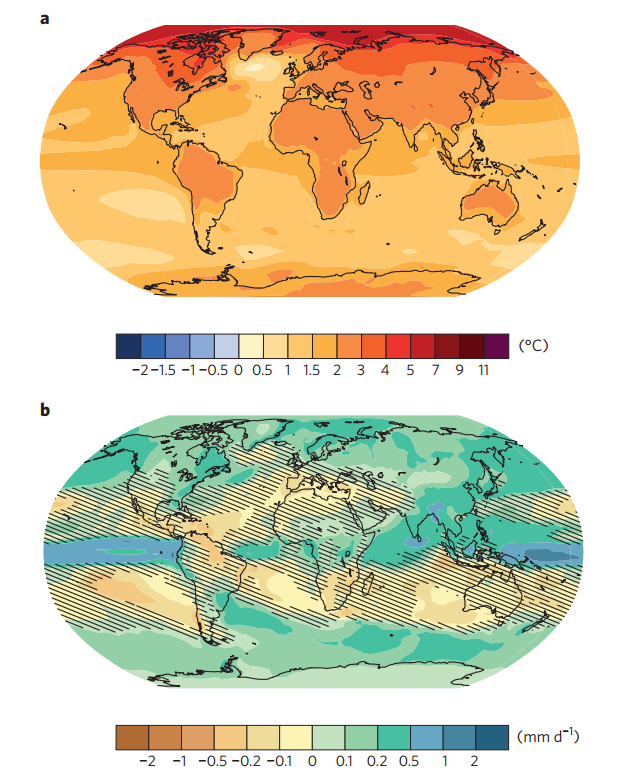
Hatching indicates where the changes aren’t robust across models, in the sense that the multimodel mean change is less than the natural variability. Clearly, there’s a big difference between panel a, which doesn’t have any hatching, and panel b, which has a lot of hatching. The pattern of warming is also pretty robust across emission scenarios and assumptions about climate sensitivity.
Looking at panel a, some large-scale features stand out:
- The land warms more than the oceans
- The largest warming is in the Arctic
- There's less warming over Antarctica
- The smallest warming is in the North Atlantic, just south of Greenland
- There is enhanced warming over the equator
- There's also reduced warming in the south-east Pacific, off the coast of Peru.
In addition to consistency across models, our confidence in the regional pattern of warming comes from having relatively good understandings of what causes these features. Xie et al go over some of these explanations, but I wanted to spell them out in more detail.
Greater warming over land than over the oceans
A first-order explanation for why land warms more than ocean comes from quasi-equilibrium theory. Assume temperatures over land and over the oceans are moist adiabatic: they follow dry adiabats up to the lifting condensation level (LCL), and then moist adiabats higher up. The LCL is lower over the oceans, since the air over the oceans is moister. Next, assume that temperatures over land are the same as over the oceans at the height of the land’s LCL. Working back down, the land surface is warmer because of the difference in lapse-rates between the heights of the ocean’s LCL and the land’s LCL (compare black lines in the schematic).
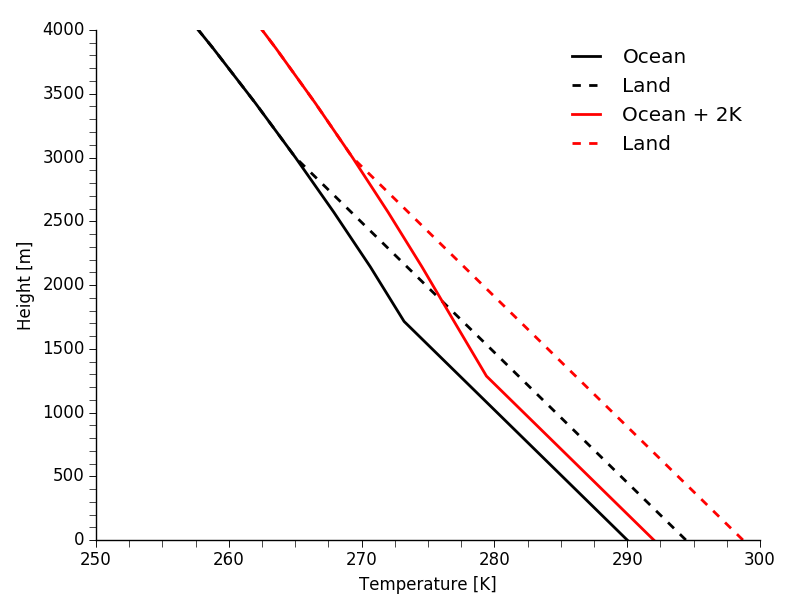
If the ocean surface warms, the moist adiabat over the ocean between these two heights is reduced, but the dry adiabatic lapse-rate over the land is fixed, so the land warm up more than the ocean. This is compounded by a lowering of the LCL over the ocean, as well as a reduction in the relative humidity over land, which moves the LCL over land further up, both which further amplify the difference in responses.
Some other important factors include differences in the responses of sensible and latent heat fluxes and differences in the responses of clouds. For instance, Joshi et al. (2008) suggest that the reduction in relative humidity over land cause reductions in local cloud cover, which further amplify the land-ocean warming contrast. As with anything involving clouds however, there is some an uncertainty about this mechanism.
Some references:
- Byrne and O'Gorman (2013) and see follow-ups for similar theories for the different responses of relative humidity over land and ocean.
- Joshi et al. (2008) for similar theory and also discussion of clouds.
Arctic amplification of warming
Amplification of warming at high latitudes is seen in models ranging from highly idealized to comprehensive climate models. There are number of reasons for this, but first it’s worth noting that the forcing due to increasing atmospheric CO2 is actually tropically-amplified, so in the absence of feedbacks there would be more warming in the tropics. Water vapor also promotes tropical amplification, because the water vapor feedback is largest there.
In idealized models, these are countered by the Planck feedback (by T4 colder regions have to warm up more), increases in poleward energy transport and differences in the lapse-rate feedback, which is positive at high latitudes and negative at low latitudes. In comprehensive models a major additional factor in Arctic amplification is reductions in albedo due to reductions in snow cover and sea-ice. It’s less clear how clouds, surface fluxes and ocean transport contribute to polar amplification, but their effects seem to be secondary.
Some references:
- Pithan and Mauritsen (2014) for a CMIP5 model perspective.
- Henry and Merlis, and Lutsko and Popp (2018) for more idealized perspectives.
- Cronin and Jansen (2016) for understanding lapse-rate changes at high latitudes.
Relatively muted warming over Antarctica
So why does Antarctica warm up less? Since idealized models show polar amplification, the answer must be in effects that aren’t included in models without continents, realistic oceans, etc.
The main factor seems to be that the mid-latitude jet in the southern hemisphere tends to shift southwards in global warming simulations. This induces northwards Ekman flow in the Southern Ocean, which brings cool waters up to the surface around the Antarctic continent. These cold waters originally sank in the North Atlantic, so it takes centuries for them to “feel” the effects of climate change. The cold waters also promote sea-ice growth, which increases the albedo around Antarctica, and one more effect is that the northwards Ekman flow advects extra energy taken up by the ocean to lower latitudes, away from the Antarctic continent.
In these ways, the Southern Ocean acts to insulate Antarctica from global warming. Cloud changes may also play a role in cooling the mid- to high-latitudes in the southern hemisphere, though this is less certain.
Some references:
Reduced warming over the North Atlantic
Reduced warming over the North Atlantic, or even a warming “hole”, is seen in observations as well as in simulations of future warming. There are a few different factors at play, and as far as I can tell the jury is still out on the exact contribution of each factor.
First, the reduced warming is often said to be caused by a slow down of the AMOC. So less heat is transported northwards into the surface waters of the North Atlantic, which cool as a result. Melting of the Greenland ice sheet could also play a role, as the cold, fresh run-off flows into the North Atlantic (though since climate models have fixed ice sheets they can’t capture this effect). Similarly, changes in ocean circulation cause increased flow of cold, fresh water into the North Atlantic from the Arctic Ocean and from the Labrodor Sea. Both of these effects also act to shut off the convection in the North Atlantic. Since this convection effectively moves heat upwards by bringing cold water down, the reduced convection leads to further cooling of the North Atlantic and to a further slowdown of the AMOC.
Some references:
Enhanced warming over the equator and reduced warming in the southeast Pacific
The enhanced equatorial warming is particularly noticeable in the Pacific ocean, and is mostly due to coupled atmosphere-ocean dynamics. As the tropical atmospheric circulation slows down, upwelling of cold water at the equator is reduced, inducing additional warming at the equator. Reduced evaporative cooling, because of near-surface increases in stability and relative humidity, may also play a role, though this seems to be less certain.
Coupled dynamics are also responsible for the slower warming over the southeast Pacific, through a wind-evaporation-SST (WES) feedback: an increase in surface wind speed increases evaporation and this cools SSTs locally, which in turn further increases surface wind speeds. The WES feedback has already been identified as playing a role in ENSO dynamics, and experiments suggest that CO2 forcing causes an initial cooling of SSTs in the southeast Pacific, kicking off the WES cycle.
- Xie et al (2010) is a useful reference for both these features.