I’m still trying to understand Arctic amplification – why the Arctic warms up faster than anywhere else when CO\(_2\) concentrations are increased (see previous post here). The top panels of this plot show average December-January-February (DJF) temperature profiles over land, ocean and ice regions north of 65\(^\circ\)N for a simulation with the GFDL-CM3 model under the RCP8.5 scenario (Arctic amplification is mainly seen in Northern Hemisphere winter). The profiles are averaged over each decade of the 21st century, going from 2006-2015 (blue) to 2086-2095 (red).
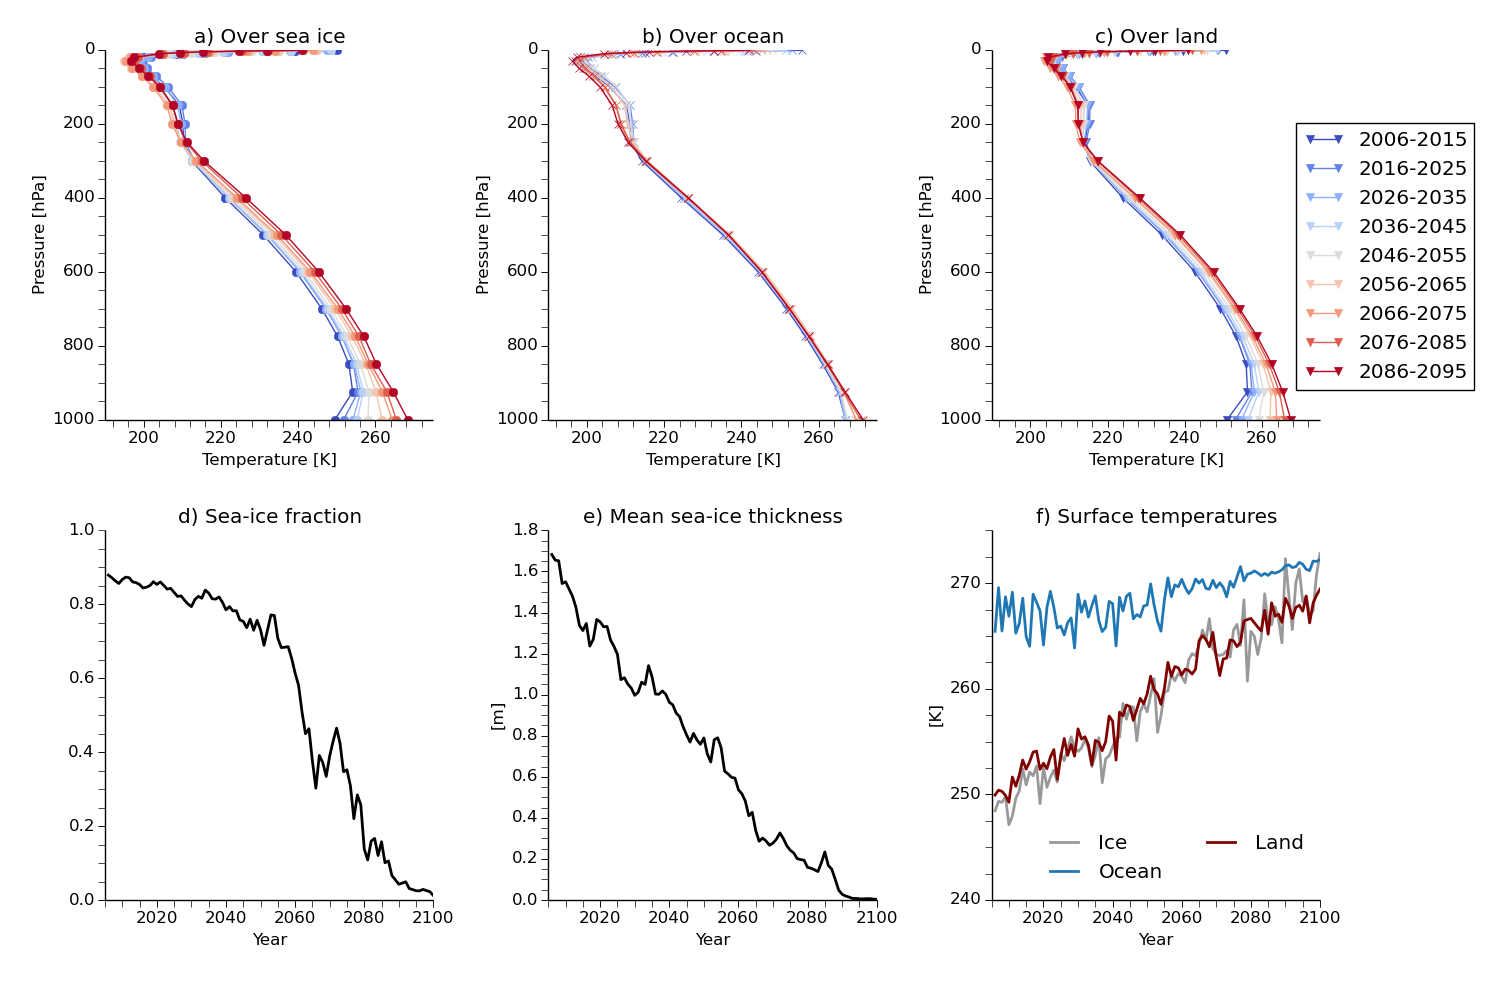
The bottom panels show time series of sea-ice fraction, sea-ice thickness and of surface temperatures over the three surfaces. Temperatures over ice and over land warm rapidly, while the ocean warms more slowly. The same plot for the HadGEM2-CC model gives a similar picture, though the ocean warms more quickly:
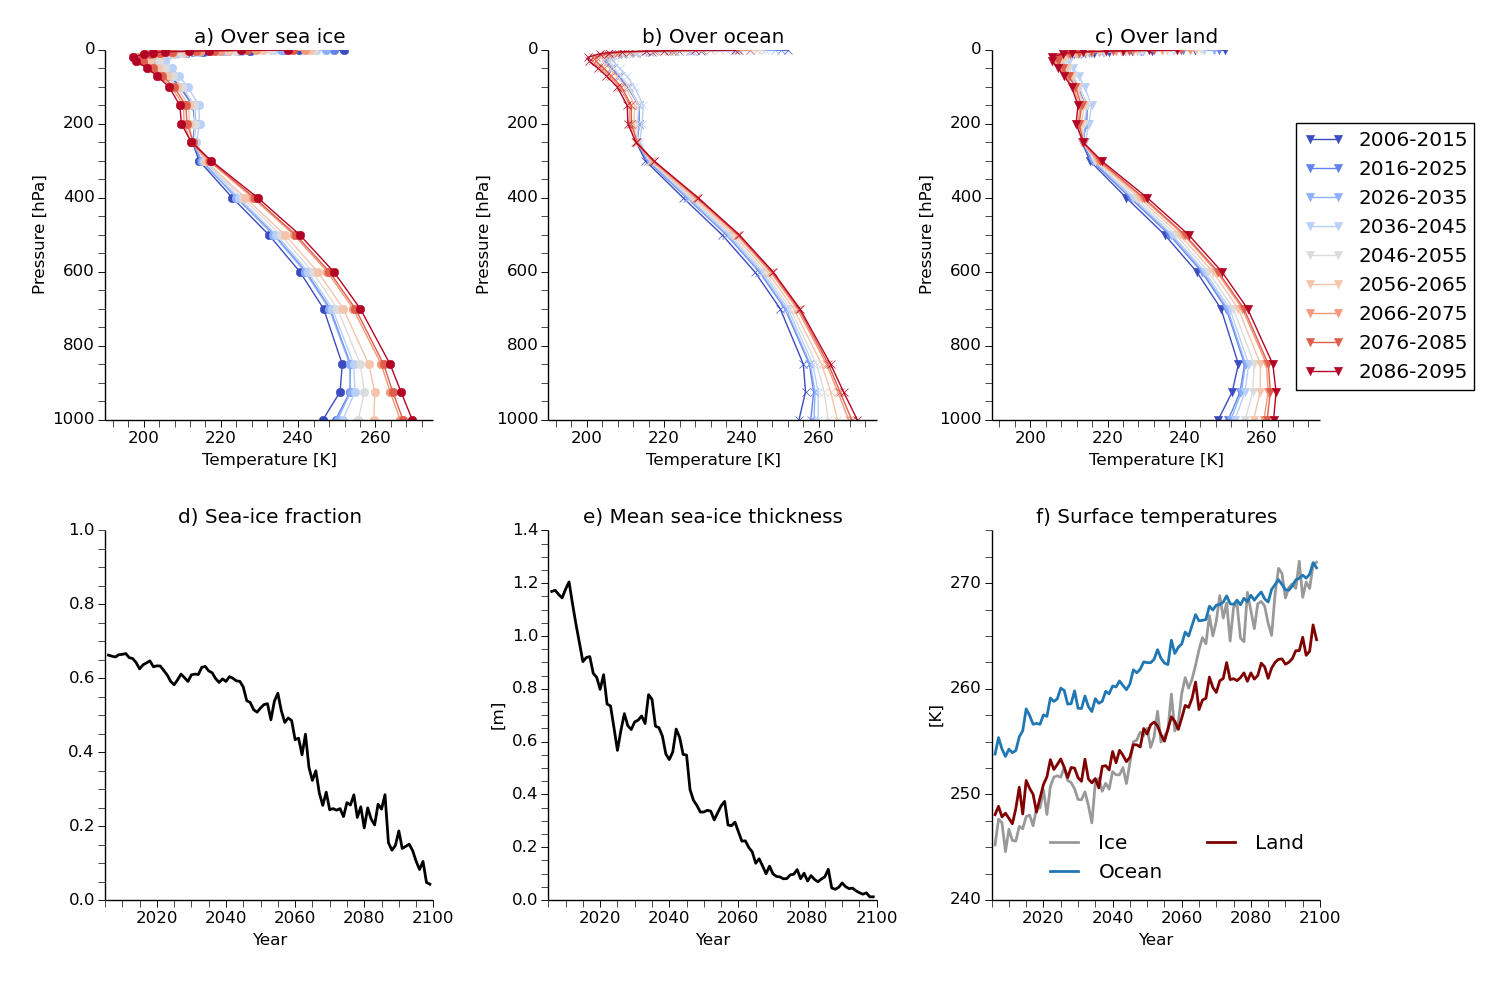
I think this is because the sea-ice is more “binary” in the GFDL model – grid-boxes tend to have either all ice or all ocean – whereas the HadGEM model has more intermediate sea-ice fractions. Since I average by multiplying by (1 – sea-ice fraction), etc. there is more aliasing of open ocean temperatures and sea-ice temperatures in the calculations for this model.
In any case, both simulations suggest that diminishing sea-ice cover is an important part of Arctic amplification. Interestingly, the sea-ice fraction collapses in both models around 2060, and this corresponds to a rapid warming of land temperatures in the HadGEM model, but there aren't any changes to the trends in the GFDL model. These differing responses could be due to differences in the aggregation of sea-ice in the two models: temperatures over sea-ice will be more strongly affected by advection if the sea-ice is fractured into lots of little clusters instead of a few larger groupings.
Some Other Studies
In a 2009 paper, Deser et al. compared a control simulation with CAM3 (an atmosphere-only model) with a simulation in which sea-ice concentrations were set to those at the end of the 21st century. Nothing else was changed in this simulation, and SSTs at locations without sea-ice were set to the freezing temperature, so the authors really isolated the effects of changes in sea-ice cover, which came from a coupled model simulation run under the A1B scenario.
These sea-ice changes produced strong warming over the Arctic Ocean and the surrounding continents, and Deser et al. calculated heat budgets to understand why this was happening. They found that over the Arctic ocean the air mainly warmed because of increased heat transfer from the ocean to the boundary layer, while over land the warming was mostly due to horizontal advection of warm air from over the ocean ("V + H Diff)” is the change in the surface fluxes between the two simulations):
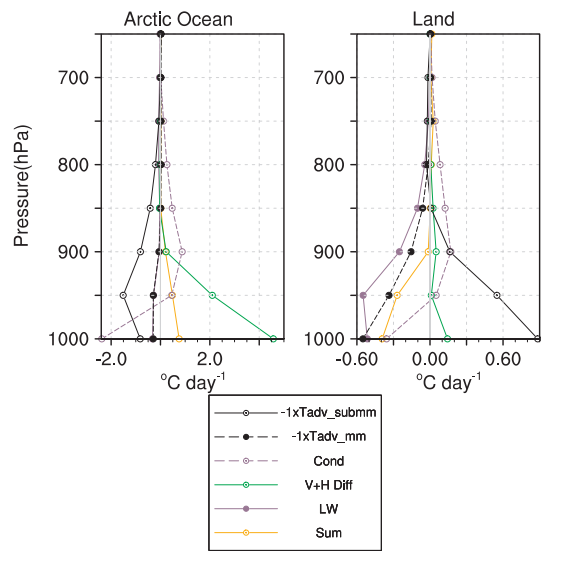
The heat transfer increased over the Arctic Ocean because there was more exposed ocean and less sea-ice, and the strongest warming was in the winter months (NDJF), even though the largest sea-ice reductions were in the fall months (September and October). Deser et al. argued that this is because the surface energy fluxes are strongest in winter, when the air-sea temperature difference is largest.
Another study demonstrating the importance of sea-ice is Dai et al. (2018), who managed to eliminate the Arctic amplification in the CESM1 model by keeping sea-ice fixed. Looking at CMIP5 simulations of the next few hundred years, they found that that increased turbulent fluxes over newly exposed ocean are an important reason for Arctic amplification, like Deser et al. But because the Arctic ocean can warm in these simulations, the increased upward longwave flux from the ocean surface also warmed the lower atmosphere. Their Figure 3 suggests that the longwave will contribute about half or two-thirds as much as the surface fluxes to Arctic amplification over the next few hundred years.
What About the Radiative Forcing?
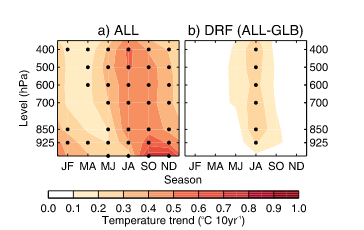
In the radiative-advective model, which we think is a good representation of the high latitude atmosphere, radiative forcing causes the kind of surface-amplified warming seen in the first two plots of this post. Radiative forcing also causes the stratosphere to cool, which is seen in those plots as well. But Screen et al. (2012) found that, comparing a simulation of the period 1979-2008 ("ALL") with a simulation with fixed greenhouse gas concentrations but with observed sea-ice cover and SSTs ("GLB"), the strongest response to the direct radiative forcing of greenhouse gases is in summer (their Figure 4):
We can get an intuitive feel for why CO\(_2\) forcing is strongest in summer by considering the sensitivity of surface temperature to optical depth changes for a gray atmosphere in radiative-advective equilibrium (equation 19 of Cronin and Jansen, increasing the optical depth in this model is like increasing CO\(_2\) in Earth's atmosphere):
\(\frac{\delta T_s}{\delta \tau_0} = \frac{2(1 - \beta)F_s + (\frac{2b}{b + 1} - \beta F_A)}{4\sigma t_s^3(2 + \beta\tau_0)^2}\)
Without going into the details, the sensitivity is directly proportional to \(F_s\) -- to the amount of insolation reaching the surface. This is zero at high latitudes during winter, so the sensitivity to radiative forcing is weak in DJF.
Wrap-up
Stuecker et al. (2018) showed that horizontal energy transport isn’t required to produce strong polar amplification; “local processes” are enough. Screen et al. showed that the high latitudes are most sensitive to radiative forcing in summer, while Arctic amplification is primarily a winter phenomenon. One reason for this is that the sensitivity of high latitudes to radiative forcing is, in part, proportional to the high-latitude insolation, which is zero in winter.
So this leaves sea-ice loss as the primary cause of Arctic amplification. As ice melts, more open ocean is exposed, and there is greater heat transfer from the surface to the lower atmosphere. In turn, more warm air is advected over the ice and land-surfaces, which warm. Feedback analyses show that the reduction in high-latitude albedo due to sea-ice loss is a secondary factor for Arctic amplification, but these analyses also say that the most important cause of Arctic amplification is the lapse-rate feedback. The positive high-latitude lapse-rate feedback and the negative low-latitude lapse-rate feedback do contribute to Arctic amplification, but the high-latitude feedback is really hiding the effects of sea-ice loss, which erodes the Arctic inversion (see previous post).
The importance of sea-ice is one reason why Arctic amplification is difficult to understand. Idealized models without sea-ice often show Arctic-amplified warming because of changes in meridional heat transports and their corresponding effects on lapse-rates (see here and here). But these could plausibly be counteracted by the water vapor feedback, which typically isn’t included in gray radiation, “Frierson”-type models, and is largest at low latitudes. Untangling these different factors in idealized models is useful, but seems to be of secondary importance if the main cause of Arctic amplification is sea-ice loss.
(Thanks to Nadir Jeevanjee for discussions and for pointing me to the Dai paper)