Two recent papers (Jiménez-de-la Cuesta and Mauritsen, 2019; Nijsse et al, 2020) used historical warming rates, particularly since 1970, to put transient climate sensitivity towards the lower end of the model range, with one also putting equilibrium climate sensitivity on the lower end. Meanwhile, many of the CMIP6 models have high climate sensitivities, and do a poor job at reproducing historical warming rates.
On the other hand, “physical” emergent constraints, typically based on low cloud variability, are putting equilibrium climate sensitivity on the upper end of the model range, or at least higher than the model mean. See here for a nice summary.
Something that’s been bothering me then, is how we can reconcile what these two different approaches are telling us about Earth’s climate sensitivity. Is there something fundamentally wrong with one of these approaches? Or are they consistent in some non-obvious way?
At a first pass, the cloud-based emergent constraint framework is difficult to unpack. It seems pretty robust that we can take measures of low cloud variability -- let’s summarize them all by a quantity \(C\) -- and correlate them across models with climate sensitivity (this is something I've worked on). So we have: $$ ECS = \alpha \times C. $$ If we measure \(C\), and take \(\alpha\) from models, we can estimate Earth’s ECS. But it’s hard (impossible?) to say whether the co-efficient \(\alpha\) is the same for the real world as it is in models. If you are inclined to believe the historical warming rates more, you could just not believe in the model \(\alpha\). But it would be hard to prove this either way.
Going back to the constraints based on historical warming rates, I do think there are at least 2 reasons to be suspicious:
1. Dependence on end point (i.e., the hiatus problem)
Compare these simulations with two different coupled models of the 1880 to 2000 period:
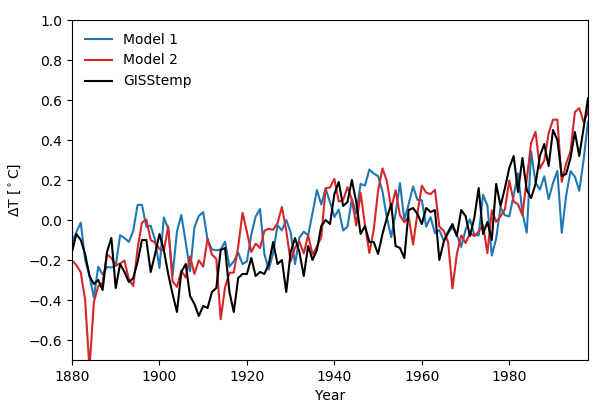
Both models do a good job of matching the obs, though the red curve does a bit better over the last few decades of the 20th century. Now look at the simulations from 2000 to 2014:
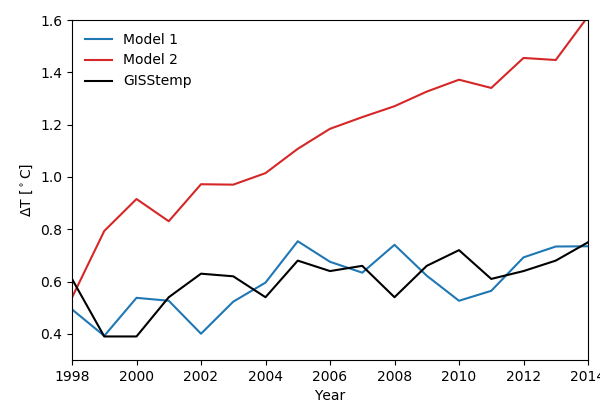
The blue curves (model 1) are MRI-ESM2.0, which has an ECS of 3.14C and a TCR of 1.56C, and the red curves (model 2) are CanESM5, which has an ECS of 5.66C and a TCR of 2.66C. If we were picking which model is better based on their simulations of the 20th century we might pick CanESM5, but adding in the extra 15 years makes it clear we should choose MRI-ESM2.0.
Looking at running 10 year trends, and adding in some more CMIP6 models, also shows how important the start of the 21st century is:
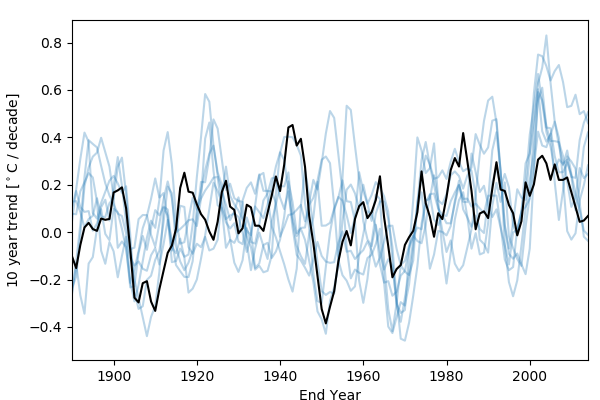
The “hiatus” in warming over the first 15 years or so of the 21st century led to a weak observed trend from the early 2000s onwards, which few models are able to reproduce. Emergent constraints based on historical warming rates, especially over shorter periods (like 1970 to present), will be strongly influenced by the hiatus, and will pick out the models that warm the least from ~2000-2015. These are likely to be low sensitivity models, since we think the aerosol forcing was weak over that period. But we also know that models struggle to simulate the correct SST patterns during the hiatus, so these models might be getting the right answer for the wrong reasons (one way of showing this is to compare the evolution of the net TOA flux). If we want to believe the low sensitivity models, we need to be confident that they are accurately reproducing the hiatus, and for the right reasons.
(Aside: the models have weak trends, or even cooling trends, for end years in much of the 90s. Looking at the temperature curves, it seems like many of the models experience a strong cooling in response to the 1991 Pinatubo eruption, much stronger than was observed.)
2. It’s harder to build a high sensitivity model that matches the historical record
More speculatively, another reason comparing with the historical record favors low sensitivity models is that you have to get more things right for a high sensitivity model to match the historical record.
To offset a large TCR, a model needs strong aerosol forcing to match the historical record. Not only that, but the aerosol forcing also has to have the right timing for the model to match the obs. The aerosol forcing seems to have flattened out over the past few decades, and this flattening out has to happen at the right time for a high sensitivity model. Getting the correct timing for this flattening is less important in a low sensitivity model:
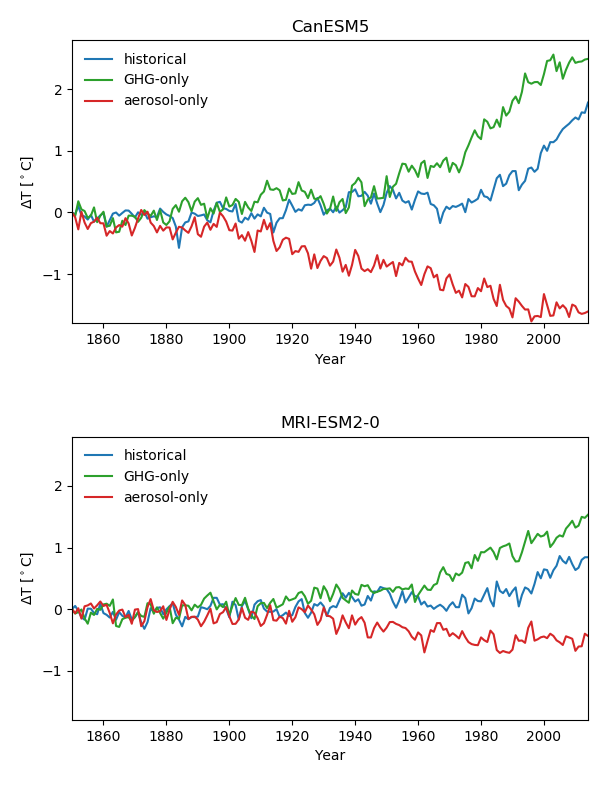
(Notice that in CanESM5 the cooling in the aerosol-only run flattens out around 1998, right when the warming takes off.)
Another factor is internal variability. If you believe that more sensitive models have larger variability (as argued here, for example), then the internal variability has to have the right phasing, or the model will always struggle to reproduce the historical record. A lower sensitivity model, with less internal variability, won’t stray as far from the historical record.
One way of thinking about this is that low sensitivity models are conservative and higher sensitivity models are “boom-or-bust”, or in terms of a bias-variance trade-off: a collection of high sensitivity models will probably have more variance, and larger biases. When comparing across an ensemble, the outliers are likely to be high sensitivity models, and constraints based on warming trends will favor the lower end, the more conservative models.
All this isn’t to say that emergent constraints based on the historical record should be thrown out, and that we should focus on the cloud-based constraints. Cloud-based constraints rely on a major, untestable assumption: that the relationship between variability and the forced response is the same in the real world as it is in models. And clearly, the historical record is one of the most important pieces of data we have for constraining climate sensitivity. But we do need to think carefully about the implications of constraints based on comparing simulated and historical warming rates.
(Thanks to Cristi Proistosescu for insightful comments and thoughts.)